The Perfect Diet Tracker lets you print your daily diary and other reports in an easy to read format.
To open the print window, select ‘Print’ from the ‘File’ menu.
The print window
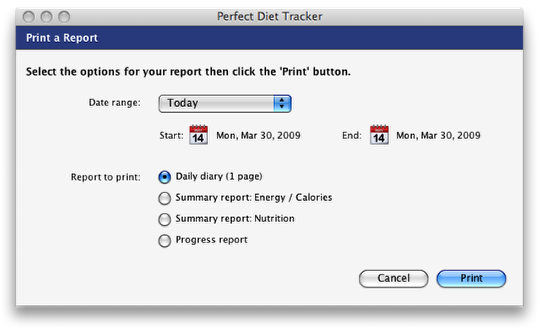
Select a date range for your report. As you change the date range the number of pages required to print your daily diary will be displayed.
Select the report you would like to print, there are four reports.
(1) Your daily diary. This will be printed on one page for each day and will contain full details of your diary for that day. The items displayed are the same as those in your diary, so if you want to include items that you do not normally display in your daily diary you may want to edit your profile first to turn on any items you want to print that may be hidden.
(2) A summary report for your calorific intake.
(3) A summary report for your nutritional intake.
(4) A progress report. The progress report will include changes to your weight and any other fields you are tracking.
Click the ‘Print’ button to start the print process, you will then be asked to confirm which printer you would like to print to and the report will be generated and sent to the printer.
If you would like to print graphs or their associated reports you can do so from the detailed graphs window.
Export reports to a CSV file
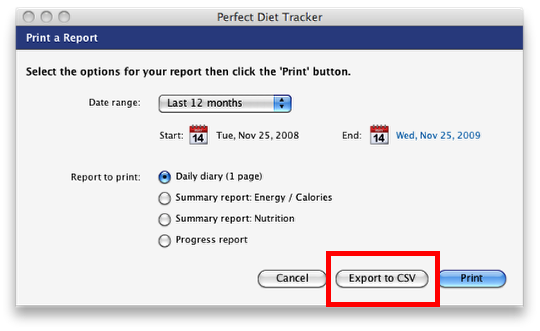
Certain reports can also be saved to a CSV file so you can import these into a spreadsheet for further analysis.
If the report can be exported simply click on the ‘Export to CSV’ button and enter a filename to create a CSV file.
Is there a way to plot net calories and exercise calories against weight in the report section? That would provide interesting insight onto possible cause and effect.
Dave
At the moment Dave, the calorie and weight charts are separate so it is not possible to overlay the two, you would need to print the two reports out with the same date range and compare the two graphs. When your net calories were under the target calories for a specific point we would expect the weight graph to show a downward trend, if you were over we would expect to see an upward trend.
Not printing out the food intake for the day only the sugars stat fats calories consumed activity credits and net calaories all the other information is blanked out